Subset points in an ordination plot
Mon Mar 12 15:08:57 2018
The subset_ord_plot function is a “convenience function” intended to make it easier to retrieve a plot-derived data.frame with a subset of points according to a threshold and method. The meaning of the threshold depends upon the method.
Load the necessary packages and data.
library("phyloseq"); packageVersion("phyloseq")## [1] '1.22.3'library("ggplot2"); packageVersion("ggplot2")## [1] '2.2.1'data(GlobalPatterns)ggplot2 package theme set. See the ggplot2 online documentation for further help.
theme_set(theme_bw())Some subsetting and light massaging of the GlobalPatterns dataset.
Clean zeros.
GP <- GlobalPatterns
GP <- prune_species(taxa_sums(GP)>0, GP)
## Warning: 'prune_species' is deprecated.
## Use 'prune_taxa' instead.
## See help("Deprecated") and help("phyloseq-deprecated").Add "human" variable to GP to indicate human-associated samples.
sample_data(GP)$human <- get_variable(GP, "SampleType") %in% c("Feces", "Mock", "Skin", "Tongue")Subset to just Bacteroidetes phylum.
GP <- subset_taxa(GP, Phylum=="Bacteroidetes")Perform a correspondence analysis and then create some plots to demonstrate using subset_ord_plot. We want to make species topo with a subset of points layered. Start by performing the correspondence analysis.
gpca <- ordinate(GP, "CCA")Now make a basic plot of just the species points in the correspondence analysis.
p1 = plot_ordination(GP, gpca, "species", color="Class")
p1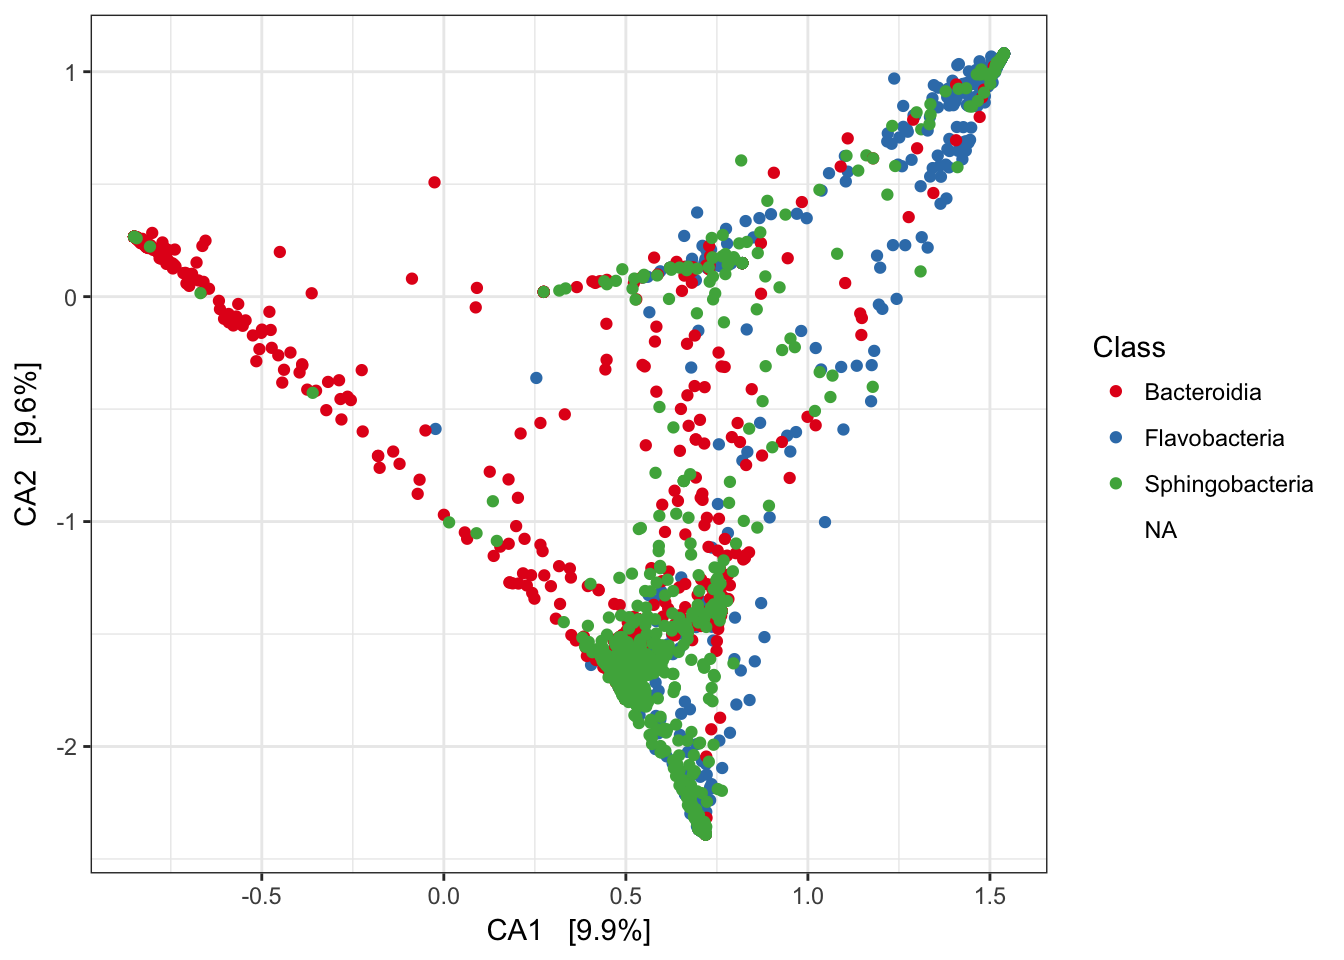
Re-draw this as topo without points, and facet
p0 = ggplot(p1$data, p1$mapping) + geom_density2d() + facet_wrap(~Class)
p0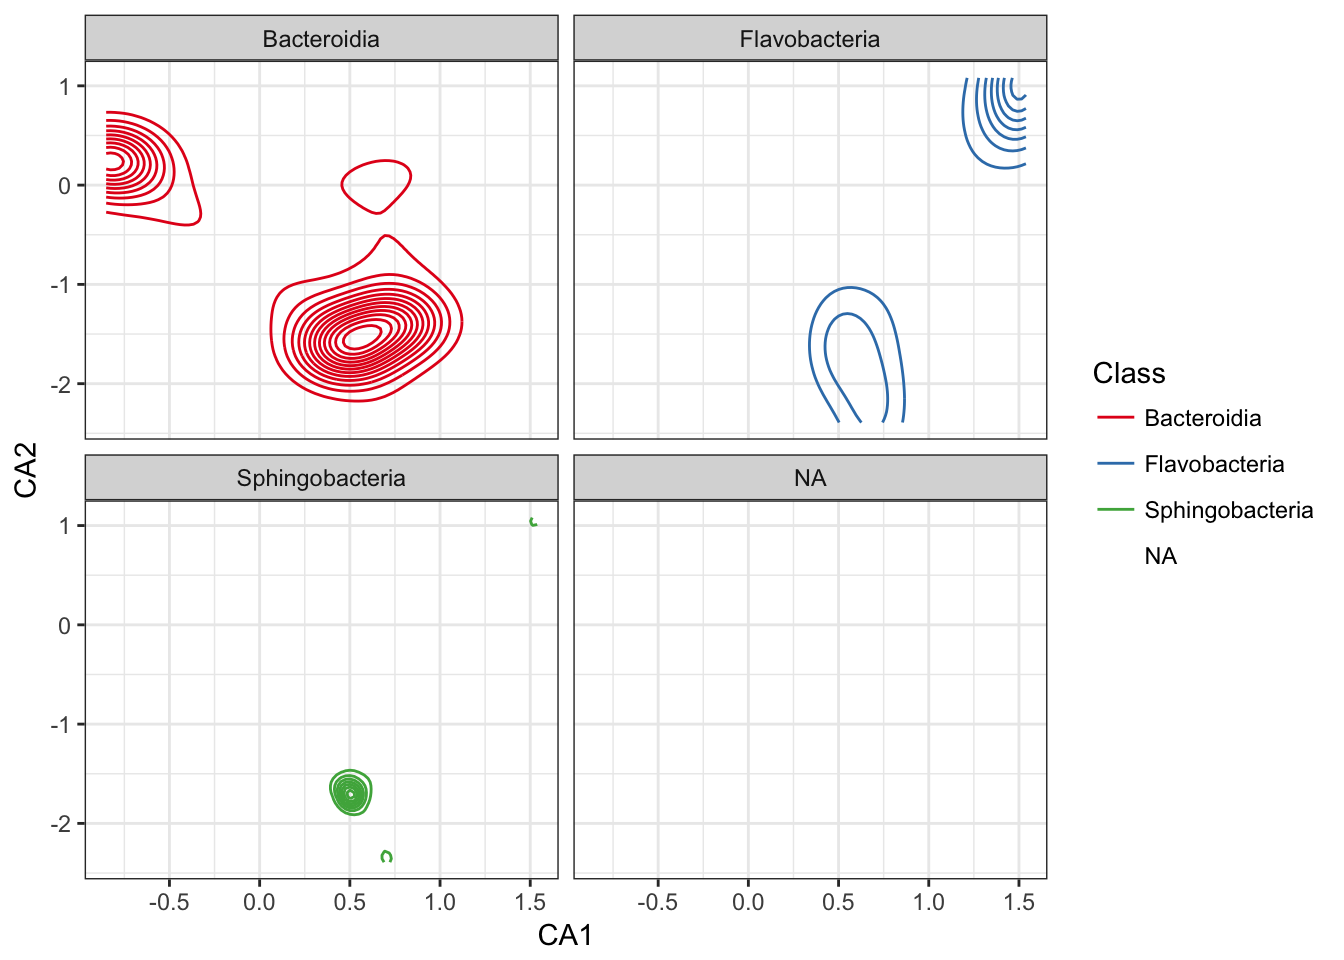
Re-draw this but include points
p1 = p1 + geom_density2d() + facet_wrap(~Class)
p1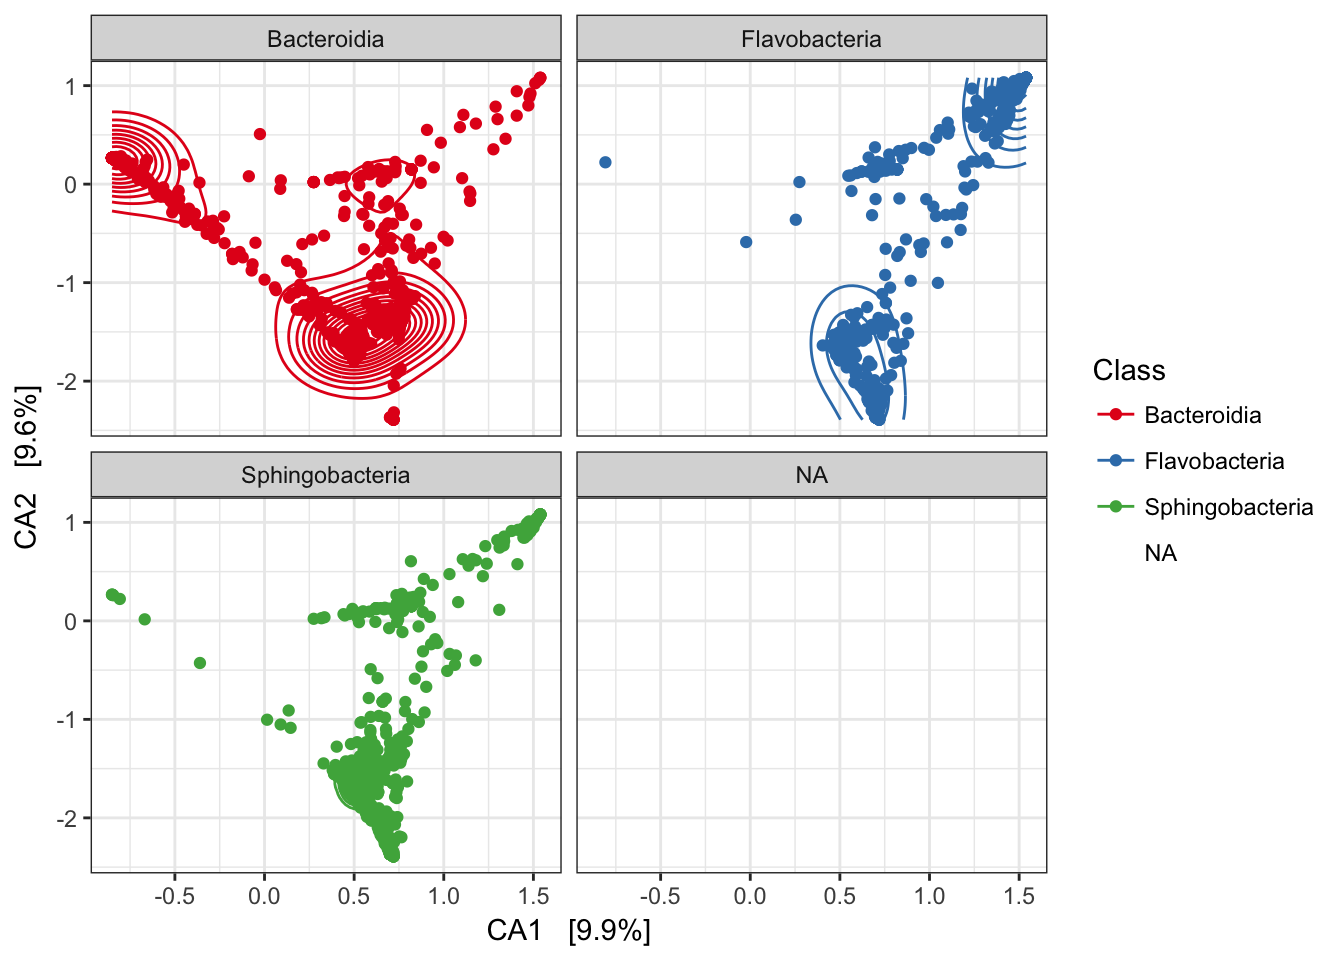
Add a layer of a subset of species-points that are furthest from origin.
p0 + geom_point(data=subset_ord_plot(p1, 0.7, "square"), size=1)## Warning: Removed 8 rows containing missing values (geom_point).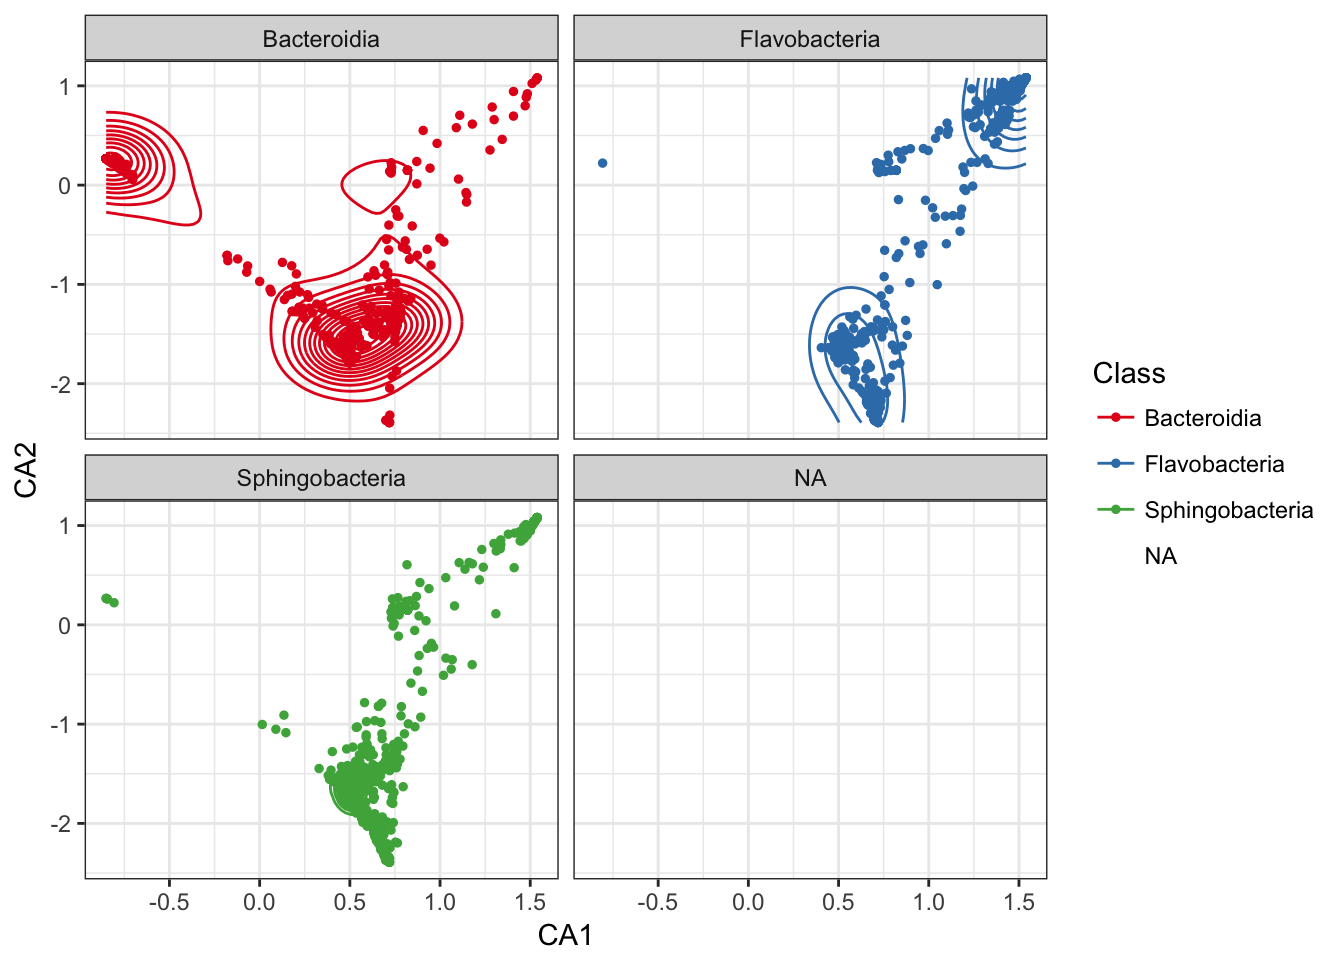
p0 + geom_point(data=subset_ord_plot(p1, 0.7, "farthest"), size=1)## Warning: Removed 6 rows containing missing values (geom_point).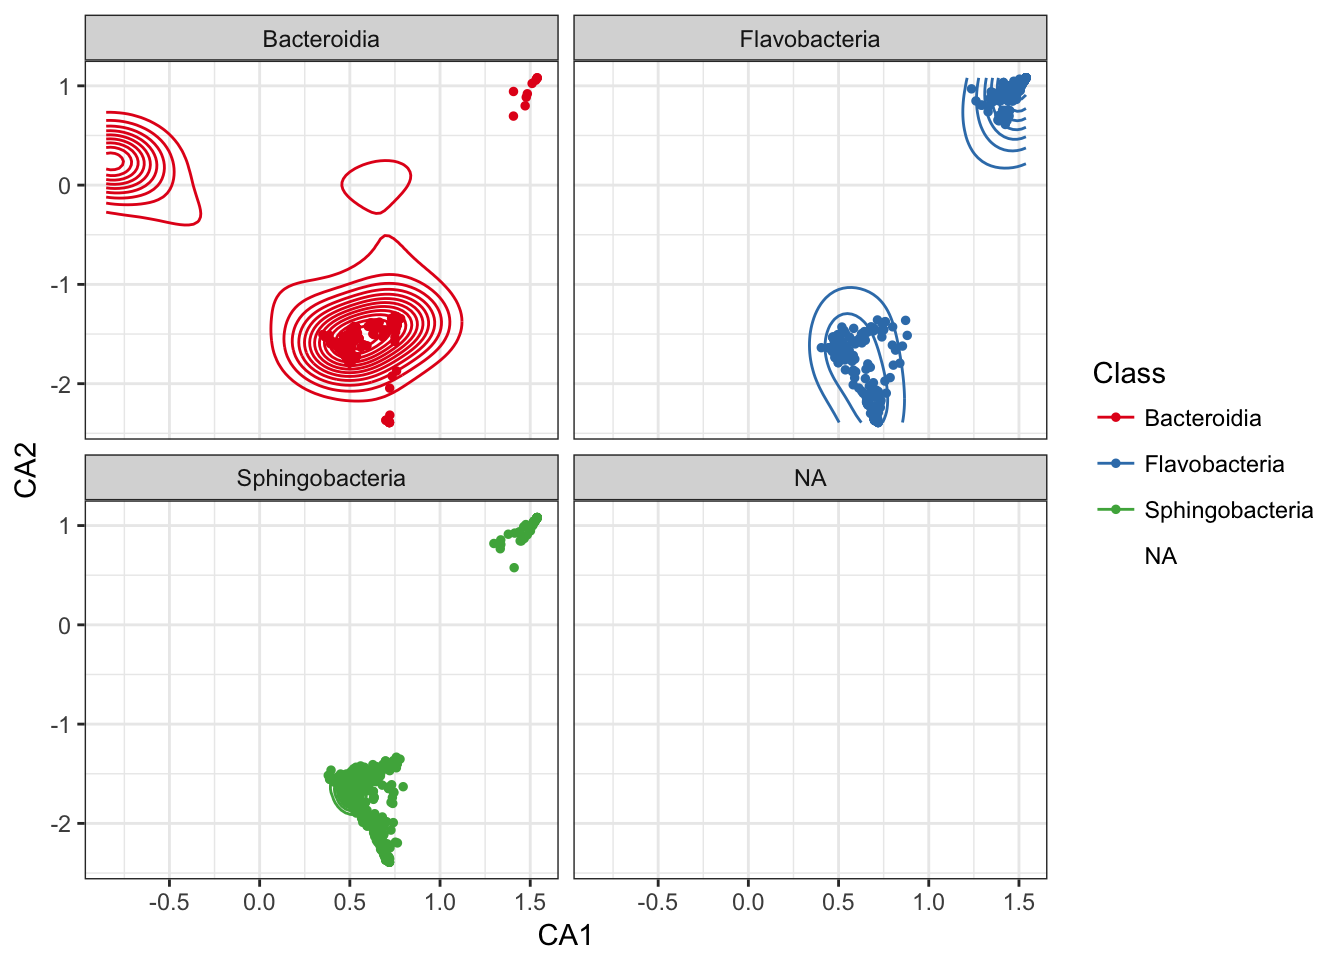
p0 + geom_point(data=subset_ord_plot(p1, 0.7, "radial"), size=1)## Warning: Removed 8 rows containing missing values (geom_point).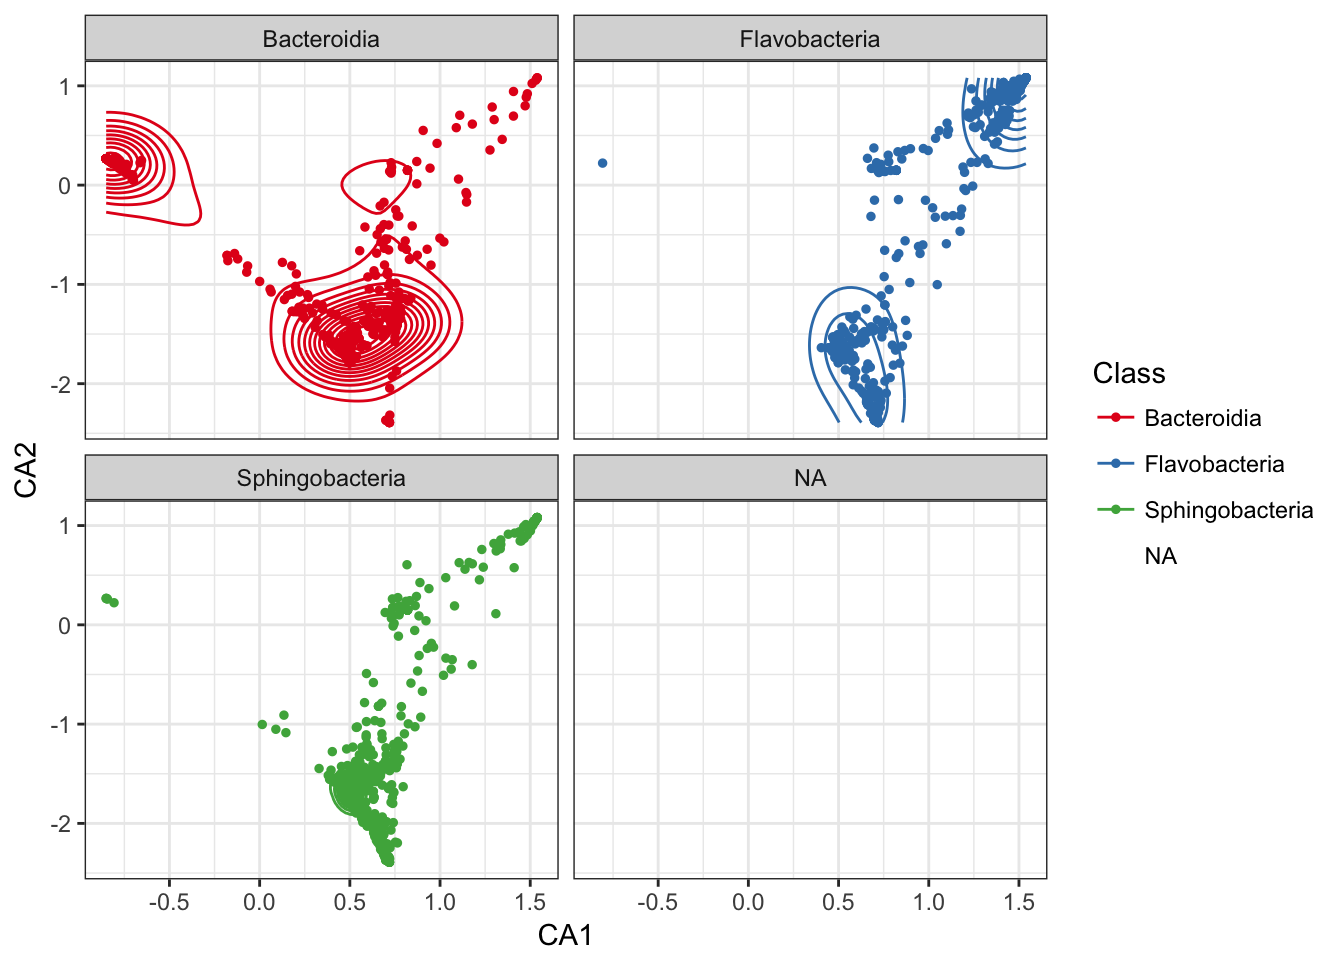
Here is what the data retreived by subset_ord_plot actually looks like
head(subset_ord_plot(p1, 0.7, "radial"))## CA1 CA2 Kingdom Phylum Class
## 554668 1.5118124 1.008842 Bacteria Bacteroidetes Sphingobacteria
## 154451 1.5385689 1.080271 Bacteria Bacteroidetes Sphingobacteria
## 244965 0.9385059 0.364721 Bacteria Bacteroidetes Sphingobacteria
## 62487 1.5268418 1.044843 Bacteria Bacteroidetes Sphingobacteria
## 139513 1.5244189 1.037502 Bacteria Bacteroidetes Sphingobacteria
## 330672 0.8197026 0.149123 Bacteria Bacteroidetes Sphingobacteria
## Order Family Genus Species
## 554668 Sphingobacteriales Balneolaceae Balneola <NA>
## 154451 Sphingobacteriales Balneolaceae Balneola Balneolaalkaliphila
## 244965 Sphingobacteriales Balneolaceae Balneola Balneolaalkaliphila
## 62487 Sphingobacteriales Balneolaceae Balneola <NA>
## 139513 Sphingobacteriales Balneolaceae Balneola <NA>
## 330672 Sphingobacteriales Balneolaceae <NA> <NA>